SYNSTORES – online
equipment performance reporting system
Take control over each store equipment performance
EVALUATION & COMPARISON OF:
- stores performance
- store equipment performance
- service performance
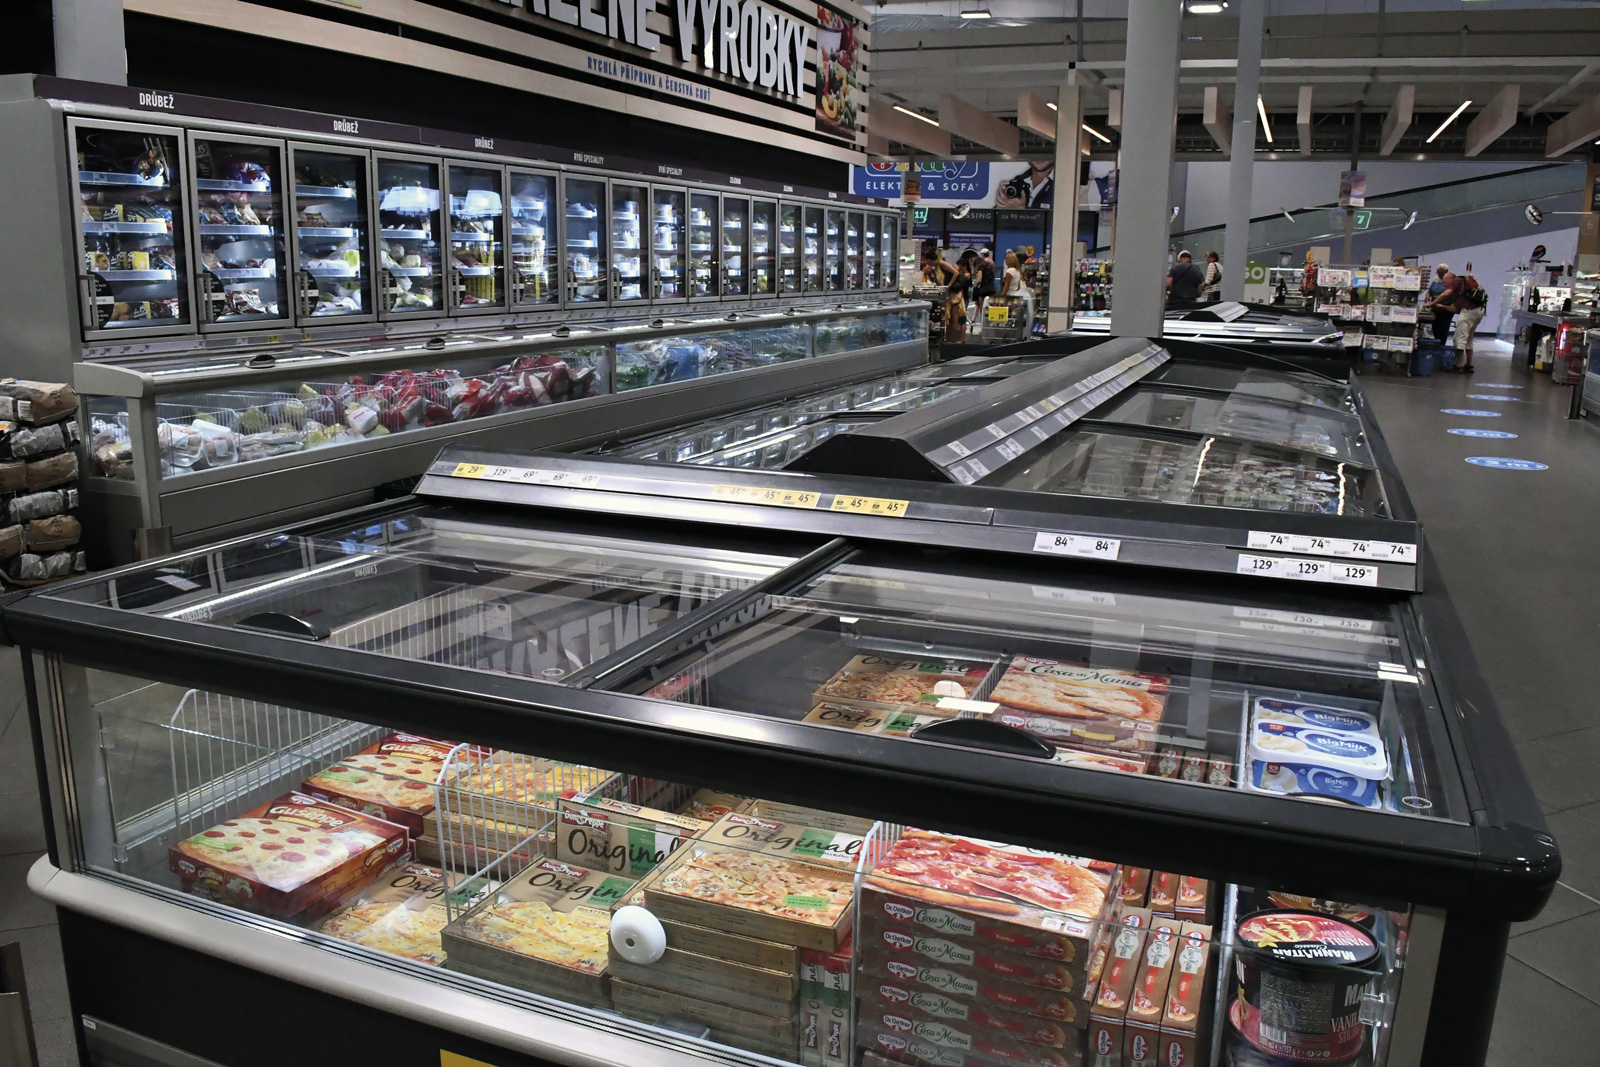
Use the data coming from equipment every 2 minutes to see online the performance and its history to evaluate the store or each single piece of equipment functionality and performance of:
- Temperature
-
Energy consumption
-
Efficiency, performance
-
Service calls and KPI ́s
Based on real data.
And compare it. By producer, brand, type, service partner.
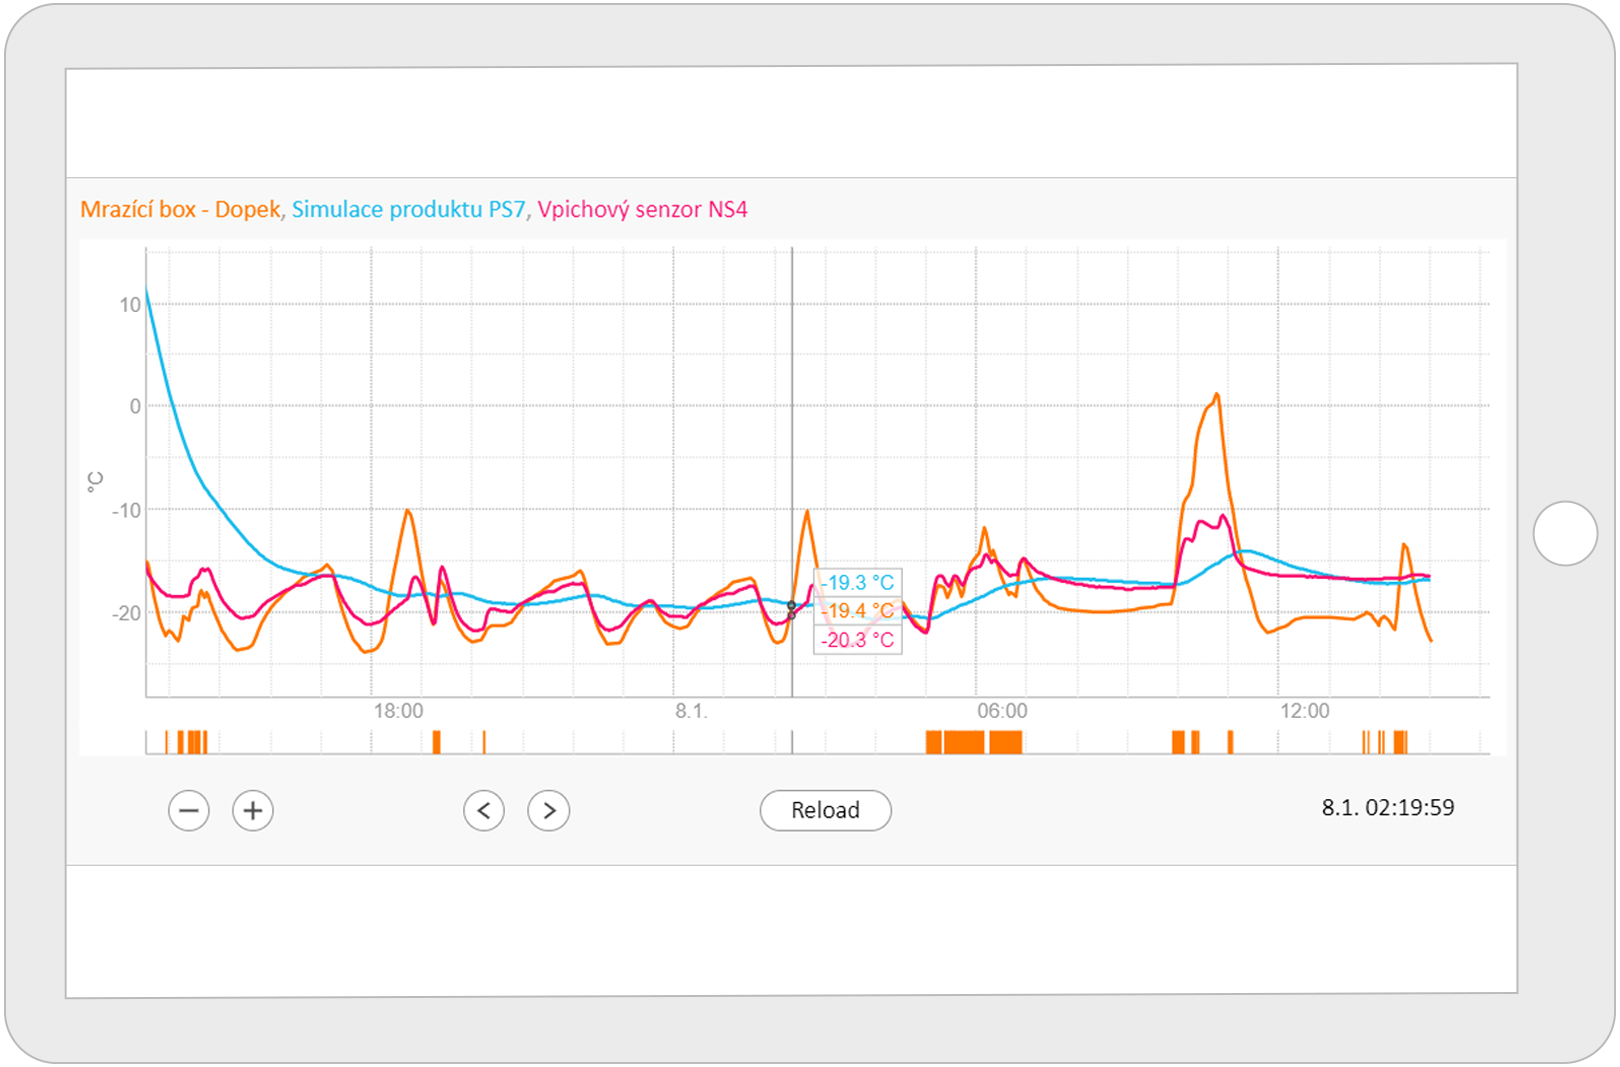
Visualized comparison of temperature curves helps you to compare and evaluate the performance of the equipment.
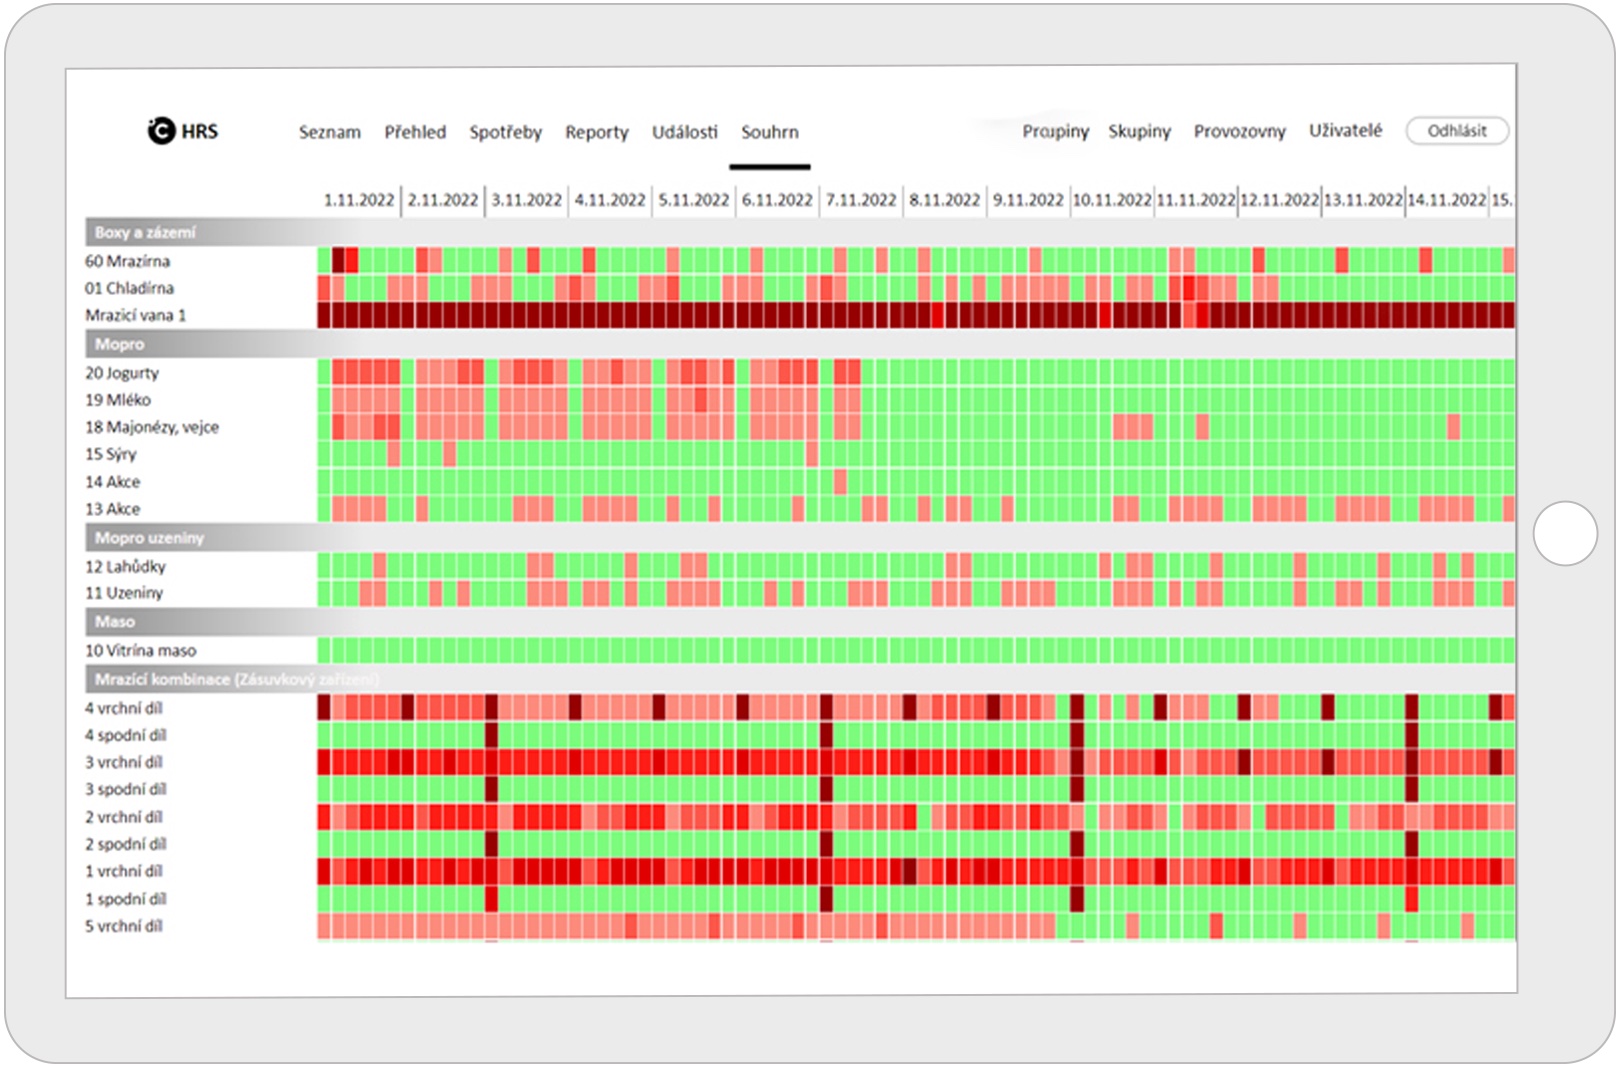
Visualized Performance of Equipment on store Monthly Statistic - View.
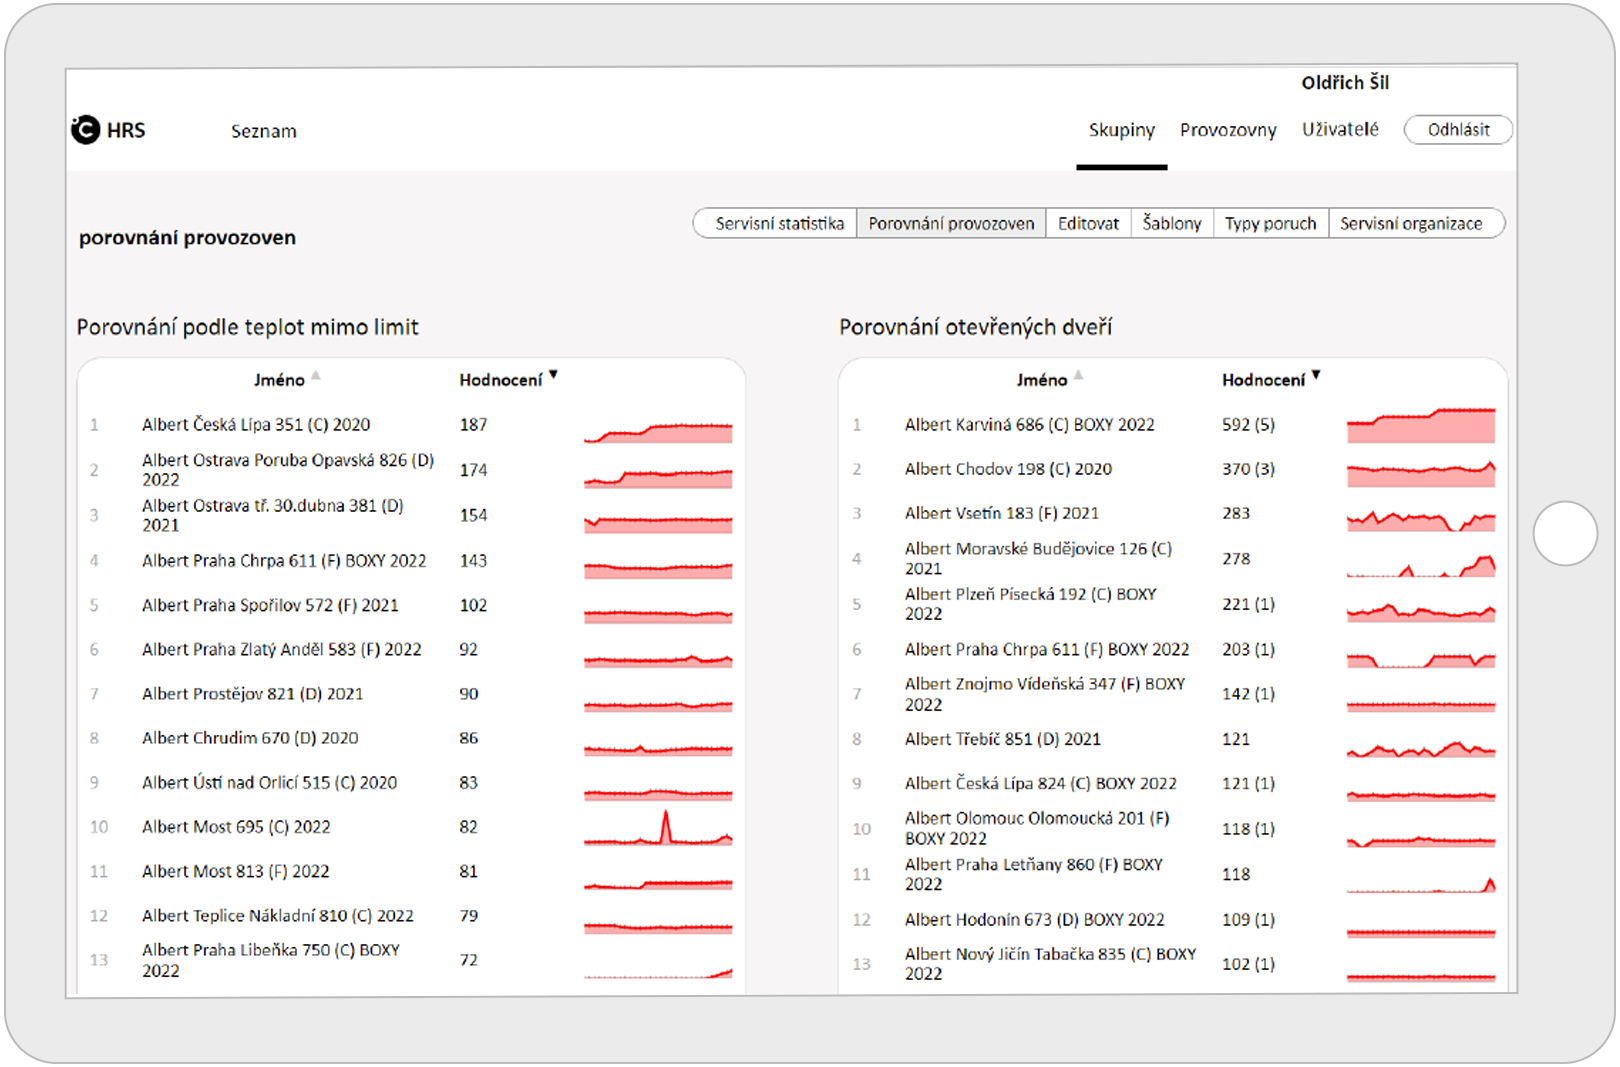
Store Performance Comparison Sheet Helps you to make very fast and addressed corrective actions.
AREAS OF OPERATION